March 2014: The Blog is Back!
Hello Friends and Followers!
I took a long absence from the blog (last post was October 2013), as I have had a very full plate, and the tail end of the schooling has consumed me. I thought today would be a good day to bring it back to highlight the weather for the week ahead. As many of you have also noticed, I had been working on getting my new graphics rolled out–snowfall charts, 7-day forecasts, etc. Unfortunately the blog became a victim of the balance of time.
Meteorological Spring started on March 1st, but traditionally we have to wait until the third week of March, when the suns rays are directly over the equator.
I am sure many of you are wondering where spring is this year–after such a brutal winter. It isn’t far off! We have a few more winter storms that will be in play, but the main thing is that the snow pack is starting to get quite a bit thinner, especially to our Southwest–even in MN! Much of the Suns energy is going to melting that snow. In areas where there is no snow cover, temps can be anywhere from 5 to 20 degrees warmer, depending on the air mass we have in place.
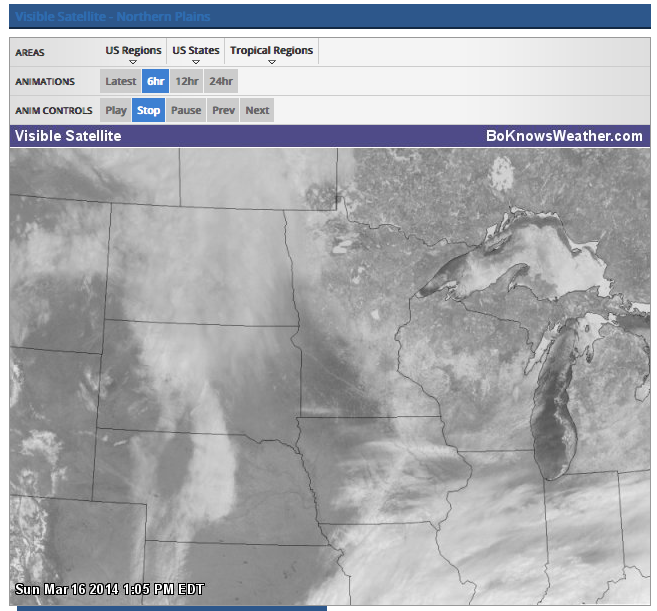
Here’s a look at the current satellite image, with the edge of the snow line just SW of the Twin Cities, as you can see on the satellite. We do have some high clouds that are starting to move in from the NW in ND…but much of the white over central MN and N MN is snow pack. You can also see the outline of the snow covered lakes (larger ones) such as Mille Lacs and some other lakes in Northern MN.

Snow Cover
We have already had a few dynamic storms so far in the early part of the year/late winter. We even had a tornado outbreak in the Ohio valley in a very similar area compared to the one that hit late last year. Since that point, these areas have resumed to getting more wintry precipitation–so there is definitely a lot of back and forth going on in the weather department right now.
Today we are seeing a storm progressing along the Gulf Coast, and it is bringing Severe Weather, and Isolated Tornadoes to the Southeast US. There is also a fair amount of Snow/Mixed Precip and Ice that will be coming into play to the North of this Severe Weather.

Severe Weather & Snow in SE

Severe Weather in SE
Another one of those storms will be coming into play mid week. This one won’t have as much of a heavy emphasis on Severe Weather in the southern plains, but there still could be some.
The models are still having a tough time sorting out the rain snow line and how much we may get. There is also some evidence on the models that the “dry tongue” may work into this storm. Some of the guidance is suggesting we may start with a few varying waves or rain on Tuesday here in MSP–before transitioning to wet snow. Then–it could cut off sharply. After this, we may see more rain, as the northern weakening edge of a thunderstorm squall line presses into the area and brings mostly a cold rain. After that, another lull—and then we get hit by some of the wrap around moisture. This is just one of the models (NAM)–but it seems to do well in the short term for some of these storms.
Again, this is just one of the models, but I really do like Weather Bell’s high resolution ‘simulated radar.’ This is not a guarantee, and does not represent my opinion fully, but this just goes to show you how complex this storm will be for us in MSP, riding the edge of the rain and snow line.
Here is the proposed onset of the storm. Please keep in mind, I am taking snippets from the hourly runs, and skipping some, so this is not a direct progression of each hourly run. I just wanted to show you the main patterns it is suggesting.
Initial phase:

nam_ref_east_14
Here’s the next angle, as some of the rain approaches MSP:

nam_ref_east_15
Next Phase as some light to moderate rain may be nearby in MSP:

nam_ref_east_17
This starts to show the rain as it is about to transition to some wet snow, before we possibly have a visit from the “dry tongue”–which is an area of dry air that wraps into these larger storm systems.

nam_ref_east_19
This next image highlights how we could see that wet snow around for a couple of hours before it pivots out of the area, and we are left with the “Dry Tongue” for a little while.

nam_ref_east_20
As you scroll through these images–that are random snap shots of varying models runs, you can begin to see the pattern and the flow, as the precipitation circulates around the Low Pressure center. Next up–we are going to possibly have that dry air in place, which could potentially cut down on totals for our area.

nam_ref_east_21
The next image shows how we may get some of the wrap around moisture after a potential “Dry Tongue” pivots out of the area. I don’t expect a ton of snow for MSP–and the rain and mix could really cut down on things here. On the back/colder side of the storm, we could get an inch or two–for a total of 1-3″ (thinking for now)–as the colder air is in play. At that point, the brunt of the moisture will be in other areas of the storm, so I don’t expect this snow to be heavy. I will continue keeping an eye on it. Any shift in the storm could drastically change that. We will will have to watch the “Dry Tongue”–as it definitely could influence totals for everyone. Dry air tends to really throw these storms off–in regards to snow. It can actually help enhance boundaries for Severe Thunderstorms, but for us, it will mostly cut down on any precipitation totals if it does develop.

nam_ref_east_23
Here’s the latest model runs–excluding GEM (Canadian Model)–as it was still running at the time of this posting:
Here’s the NAM:

nam_3hr_snow_acc_mw_29
Here’s the GFS:

gfs_6hr_snow_acc_east_15
Here’s the Euro (ECMWF):

ecmwf_tsnow_east_15
GEM (Canadian)–Was still running when I posted this.
Those are the main models I check out. There are plenty of others to consider as well. The latest Run of the Euro has brought heavier snow closer to MSP. The NAM and GFS seem to be staying similar to what they had been in recent runs.
**Here’s a proposed snowfall total graphic from my new graphics pack that I spoke of earlier. Many of you have probably seen these posts on Twitter with these graphics, so this will be nothing new for you. This is my thinking currently–but we will need to watch closely, as it seems many models are still in disagreement. As the above graphics highlight the NAM—I don’t think the storm will be that far north, but I still do expect some influence from Mixed precipitations and the “Dry Tongue.” The reason I highlighted the other graphics is to show you generally how the storm may evolve and come in waves. I think it will trend a bit farther south, but still keep much of the brunt of the snow to the North of MSP. As you can see–there is still a high level of variance among the models, so changes to my graphic are likely. Please keep that in mind.** My chart highlights the recent trend in the Euro, and the GFS…on somewhat of a hybrid basis.

Bo’s Snowfall Forecast for Tue/Wed
Here’s your 7-day forecast as well. The maps are looking interesting–meaning we may have a few more snow chances before it’s all over–and we get warmer. :)

Bo’s 7-Day Forecast
Thank you for checking in!
Stay tuned for more updates on this storm as we approach Tuesday. Many changes are still possibly and likely, as the rain/snow line is very close to home!
-Bo


