Severe Weather Risk on Sat 8/22
Hello-
Thanks for checking in. There’s been a lot of chatter about the Severe Weather Risk for Tomorrow (Saturday 8/22/15), and for good reason–it seems like it could be an active day. The NAM & GFS seem to have a good handle on it, and soon, some of the short term high-res models will be coming into play. For the sake of highlighting the event, I am taking a look at the NAM below–and giving a brief and to the point overview. Many other factors come into play, and other models/data etc, but for the sake of simplicity here, I am just showing one.
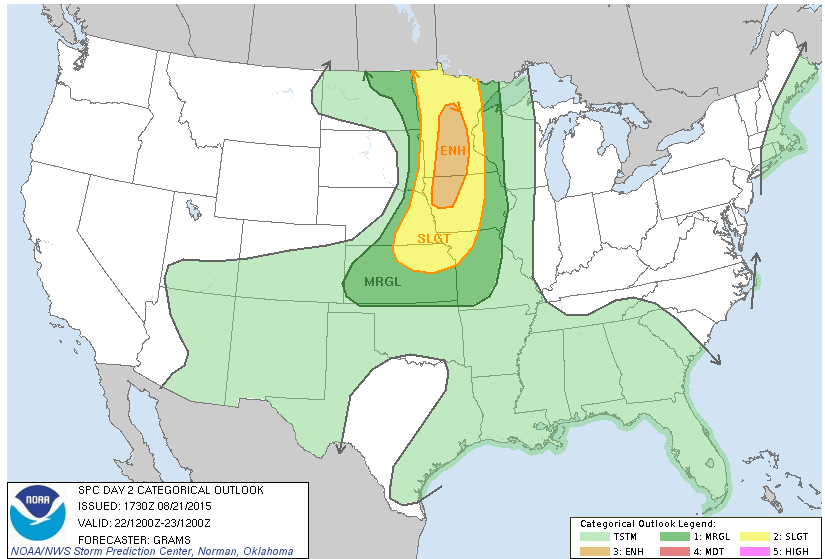
Here’s the current thinking from the Storm Prediction Center (SPC)–and they recently upgraded to an Enhanced Risk just W of the MSP area.

Enhanced Risk

Probabilities
The air temperature will be quite warm as well, with temps in the low to mid 80’s across the state, as highlighted below.

Surface Temps
Humidity will also be surging into the area out ahead of the cold front. Dewpoints will climb throughout the day, as they already have started to a bit tonight. Map below

Surface Dewpoints
In the upper levels, we have a fairly strong jetsteam coming into the picture with a trough starting to press down into the area, and a fairly strong jet streak in South Dakota. We are in the area of diverging winds aloft and PVA which leads to rising air and convection.

Jet Stream
On the previous map, it shows the general direction also for the upper level winds. Surface winds will be out of the South, with some SSE and SSW variations mixed in. Surface winds on map below. This also shows the surface low being in NW MN at the time of this snapshot.

Surface Winds
Below are two different parameters for EHI which is Energy Helicity Index, and that combines CAPE and Helicity, and is a decent indicator of where there may be good Tornado potential. We have one that is 0-1km and one that is 0-3km, so more of a surface based, and slightly higher profile of the atmosphere in these two maps.

0-1KM EHI
Next is the 0-3KM…

0-3KM EHI
CAPE as it stands alone–is High—so that will be good once the forcing of the cold front and jet streak (PVA) come into play… CAPE stands for Convective Available Potential Energy—and generally it doesn’t mean all of that much unless you have a trigger to work with, and in this case we have a cold front and the PVA coming in.

CAPE
Lifted Index values are quite substantial as well, near -9 and beyond… Generally when it goes past -5 it means there’s a good potential for Severe Weather.

Lifted Index
Soundings don’t look to bad—good surface temps, and dewpoints, along with a wedge of drier air aloft. Overall it is a fairly decent looking sounding for our area to promote severe storms. It also highlights the bit of low level wind shear. Capping shouldn’t be too big of an issue as the jet streak comes into play, and the cold front.

Sounding
A look at the Hodograph, which shows a more unique perspective of the changing wind directions with height–shows the start of the curve we need to see in the low levels, but then more of a consistent wind direction the higher up you go. Overall, not too bad. It could be sufficient for some initial spin ups, but the main threat near MSP should be damaging winds and large hail.

Hodograph
Stay tuned, as this could all change. Be sure to follow for new updates on the @BoKnowsWeather Twitter account, and Facebook.com/BoKnowsWX.
Thanks for checking in, and I appreciate your support.
-Meteorologist Bohdan Cole


