Labor Day weekend Severe Weather?
Potential Severe Weather this weekend!
Thanks for checking in!
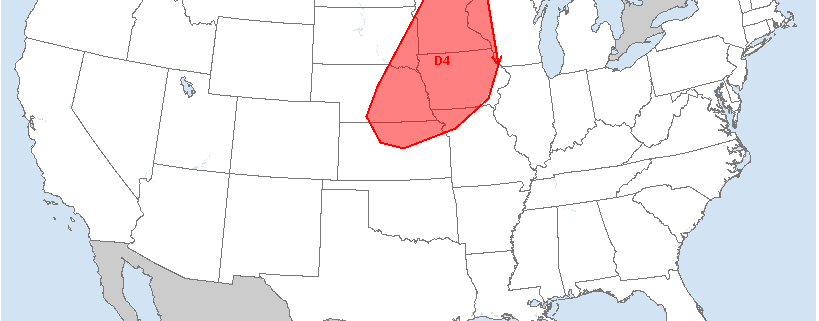
The title isn’t meant to scare you, but we do have the possibility of some Severe Weather this weekend in the Upper Midwest & Minnesota–particularly on Sunday. It still is a bit of a ways out, but it is worth watching. The interesting thing to note is that this potential event has come up on the day 4-8 Outlook from SPC (Storm Prediction Center)–for both Day 5 and Day 4. The next day or so should provide more clarity on the situation. The wording of Supercells and Tornadoes has come up, and it surely has generated a bit of buzz.
I have been seeing some people asking about the nature of this event and whether or not it is unusual.
Currently, the outlook from SPC for the Upper Midwest shows the general focus area for potential severe weather. If you want to read the specific risk statement, here is the link. http://www.spc.noaa.gov/products/exper/day4-8/
There is still a bit of model variance, but some of them are consistent with a trough moving in, and adequate wind shear, as well as overall instability that may contribute to this potential event.
GFS, NAM & the ECMWF have a good amount of moisture (higher dewpoints), with temperatures near 80 or above. All of them develop a trough over the Upper Midwest as well.
Certain locations will be difficult to pinpoint now–as it is uncertain if this event will fully pan out. I imagine there will be a swath of severe potential from Northern KS, thru NE & IA, as well as the Eastern Dakota’s, MN, and Western WI. I imagine there may be two focus areas for Tornado potential. Thru NE and IA, as well as W/Central MN, and down thru MSP area. One of the main limiting factors I can see now would be cloud cover minimizing instability in the area. If we get enough instability and everything else holds together, it could be a fairly big day for Severe Weather.
I will run thru a few maps below to highlight what is being discussed above.
Since ECMWF maps generally cannot be put out online, I will stick to the NAM and GFS as they are commonly referenced models. There are plenty of others to consider of course… These maps happen to be from TwisterData.com, one of the sources I reference.
NAM-
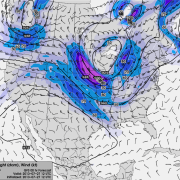
Jet Stream Winds:
Jet Stream pattern shows high wind speeds coming into leading edge of trough, which may cause it to deepen.
Surface Temps:
Surface temps will be near 80 or above for much of the area, which should provide the instability we need.
Dewpoints:
Dewpoints will be in the 60’s to near 70 in many areas, which would provide plenty of fuel.
CAPE: Convective Available Potential Energy
CAPE is marginal in much of the area except for S & E–but this could change for sure. A measure of instability.
EHI:
This is another measure of instability that ties various elements together. It generally assumes rotation should be maximized if CAPE is high. Numbers greater than 1 & 2 have been associated with significant tornadoes. Again, marginal, but on either side of this run, the amounts vary with front timing, so this isn’t too crucial to pay attention to at this current time.
Lifted Index:
Anything beyond -7 is generally a good indicator of storm activity.
Helicity:
Another ‘Shear’ product that shows areas of wind shear concern.
Crossover & Bulk Shear:
Showing where areas of wind shear may be a concern for the weekend event.
Next up is the GFS-
Jet Stream Winds:
This one also shows the trough coming into Upper Midwest, which should provide ideal dynamics.
Surface Temperatures:
Surface temps are a bit lower in this one, but this could also change.
Surface Dewpoints:
Plenty of moisture, especially to the South.
CAPE:
CAPE is marginal in this, except over Nebraska.
Lifted Index:
Like in the NAM description from before, beyond -7 is significant enough to indicate possible storm formation.
Bulk & Crossover Shear:
Moderate sheet in the area–especially based on August standards.
There are always many more factors, models, considerations & things that come into play. This is still 4 days out and has potential to not happen at all–and be a complete computer generated possibility with 0 chance of verifying. On the flip side, if consistency remains up to the day, we may be talking about significant severe weather for some areas in the Upper Midwest–Minneapolis/St.Paul included.
It is worth watching for sure, so please stay tuned! Regular updates on Twitter @BoKnowsWeather, and www.facebook.com/boknowswx & here at www.boknowsweather.com. Keep in mind, I am simply stating this is a possibility for Severe Weather, and not a guarantee. You should always pay attention to local watches and warnings from the National Weather Service and official entities. These are interpreted opinions and I do my best to educate and give my perspectives on the info that I have access to. There are others that have many more years of experience than I–so please take that into consideration as you read these blogs. I hope you enjoyed it! Stay safe this weekend and stay tuned if you are celebrating with your families!
In the meantime–here is your updated 7 day forecast for the Minneapolis/St.Paul area.
Thanks for checking in!
-Bo

